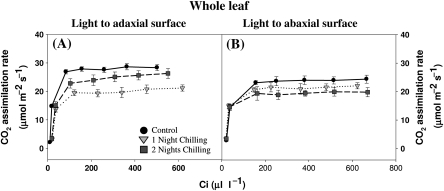
Fig. 3.
The effect of light orientation and dark chilling on the CO2-response curves for photosynthesis in whole P. dilatatum leaves. The light-response curves for photosynthesis were performed at 350 μl l−1 CO2 (corresponding to a Ci value of ∼120–200 μl l−1), which is a saturating CO2 concentration. Plants were either maintained at optimal growth temperatures (black circles), or subjected to dark chilling for either one (light grey inverted triangles) or two (dark grey squares) nights. The light intensity was orientated either to the adaxial (A) or the abaxial (B) leaf surface. Data are the mean±SE of nine plants per treatment.

