Fig. 5.
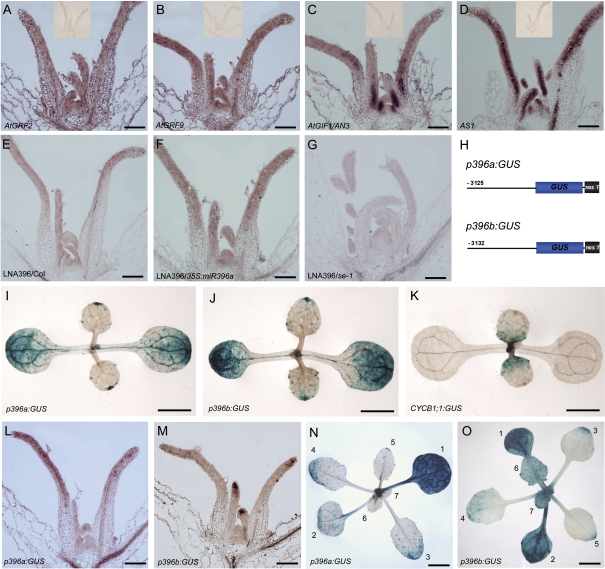
miR396 is mainly expressed in the cells arrested for cell division. (A–D) In situ hybridization analysis of AtGRF2, AtGRF9, AN3, and AS1 expression in shoot apices. The insets show no signals detected by the sense probes of the corresponding genes. (E–G) The antisense LNA probe detected miR396 in the shoot apex of wild-type (E), 35S:miR396a (F), and se-1 (G) seedlings. (H) Diagram of the structures of p396a:GUS and p396b:GUS constructs. (I–K) GUS staining to analyse the GUS distribution patterns in the 9-day-old p396a:GUS (I), p396b:GUS (J), and CYCB1;1:GUS (K) seedlings. (L and M) In situ hybridization to analyse the GUS distribution pattern in the p396a:GUS (L) and p396b:GUS (M) seedlings, respectively. (N and O) GUS staining to analyse the GUS distribution pattern in the 24-day-old seedlings of p396a:GUS (N) and p396b:GUS (O). The numbers 1–7 indicate the number of leaves. Bars=100 μm in A–G, L, and M, 0.5 cm in I–K, N, and O.

