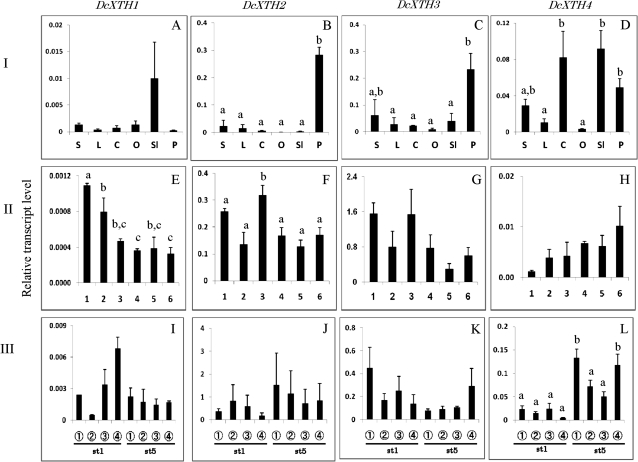
Fig. 4.
Comparison of transcript levels of DcXTH1–DcXTH4 genes among different tissues (I: A–D), and their changes in whole petals at each stage (II: E–H) and in different parts of petals (III: I–L) during flower opening. The six flower opening stages were defined as: stage 1, petals just emerged from buds; stage 2, petals elongated vertically; stage 3, petal clusters expanded; stage 4, outer petals start to bend outward; stage 5, outer petals are bent outward; stage 6, fully open flower with outer petals at right angles to the stem. Relative transcript levels are calculated by real-time RT-PCR with DcACT1 as a standard. Data are means ±SE of three independent samples, each prepared by mixing 10 outermost petals detached from five separate flowers at the respective stages. Significant difference (P <0.05) detected by Tukey's multiple range test is shown by different letters above the bars, only where there was a significant difference among determinations in each panel. S, stem; L, leaf; C, calyx; O, ovary; Sl, style+stigma; P, petal.

