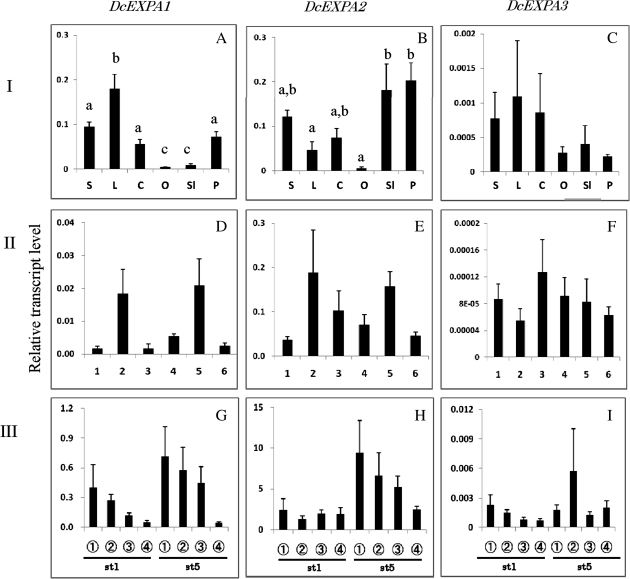
Fig. 5.
Comparison of transcript levels of DcEXPA1–DcEXPA3 genes among different tissues (I: A–C), and their changes in whole petals at each stage (II: D–F) and in different parts of petals (III: G–I) during flower opening. The procedures are the same as described in the legend to Fig. 4.

