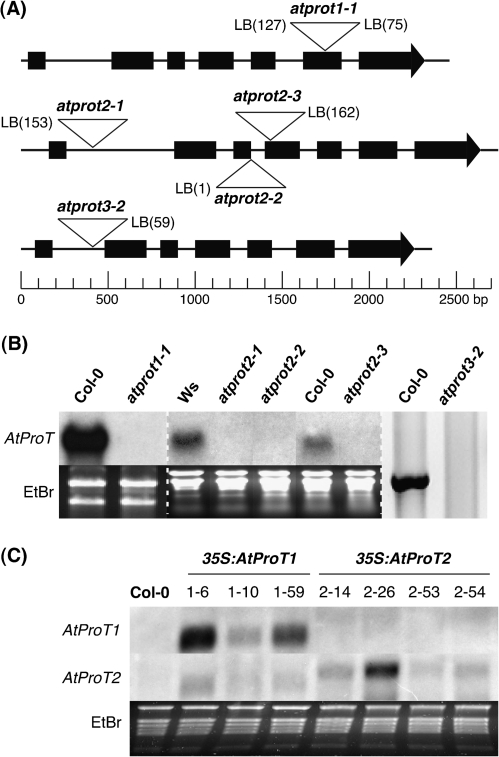
Fig. 1.
Molecular characterization of atprot T-DNA insertion mutants and AtProT-overexpressing lines. (A) Schematic representation of the exon–intron structure of AtProT1, AtProT2, and AtProT3 including the T-DNA integration sites. Genomic sequences were drawn to scale. Black boxes represent exons. The distance of the insertion site from the exon–intron border was verified by sequencing and is indicated as nucleotides in parentheses. (B) Expression of AtProT genes in several T-DNA insertion lines examined by northern blot (AtProT1 and AtProT2) or RT-PCR (AtProT3). RNA was isolated from pollen (AtProT1), salt-stressed seedlings (AtProT2), or leaves (AtProT3). A dashed line separates individual gels. The lanes of the RNA gel blot analysis of AtProT2 expression were regrouped for clarity. (C) RNA gel blot analysis of 35S:AtProT1 and 35S:AtProT2 lines (leaf tissue). Autoradiographic pictures in B and C have been adjusted in brightness levels.

