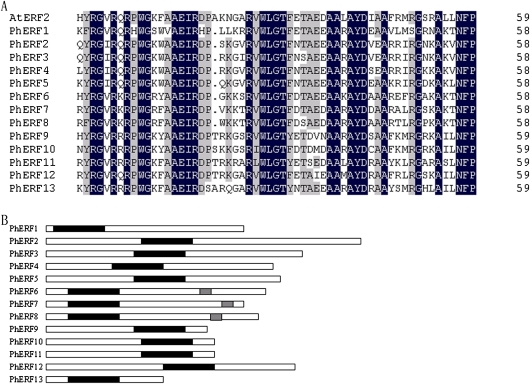
Fig. 1.
Schematic analysis of PhERFs with ERF domains and EAR repressor domains. (A) Comparison of ERF domains by deduced amino acids sequences. Conserved residues are shaded in black. Grey shading indicates similar residues in 10 out of 14 of the sequences. (B) Location of ERF domains (black bars) and EAR repressor domains (grey bars).

