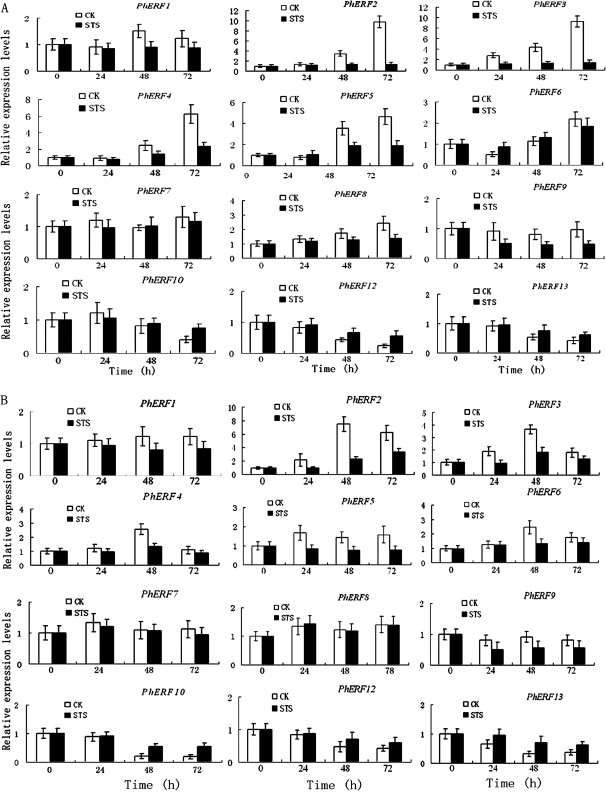
Fig. 6.
Effects of STS on the expression of PhERF1-10, PhERF12, and PhERF13 by quantitative PCR in corollas and gynoecia. (A) Effects of STS on the expression of PhERF1-10, PhERF12, and PhERF13 in corollas. (B) Effects of STS on the expression of PhERF1-10, PhERF 12, and PhERF 13 in gynoecia. The mRNA level was measured by quantitative PCR. Relative expression levels are shown as fold change values (1=time 0). Data are means ±SD (n=3).

