
Figure 6. EphB2 expression is regulated by Notch signaling and maintains ependymal cell phenotype.
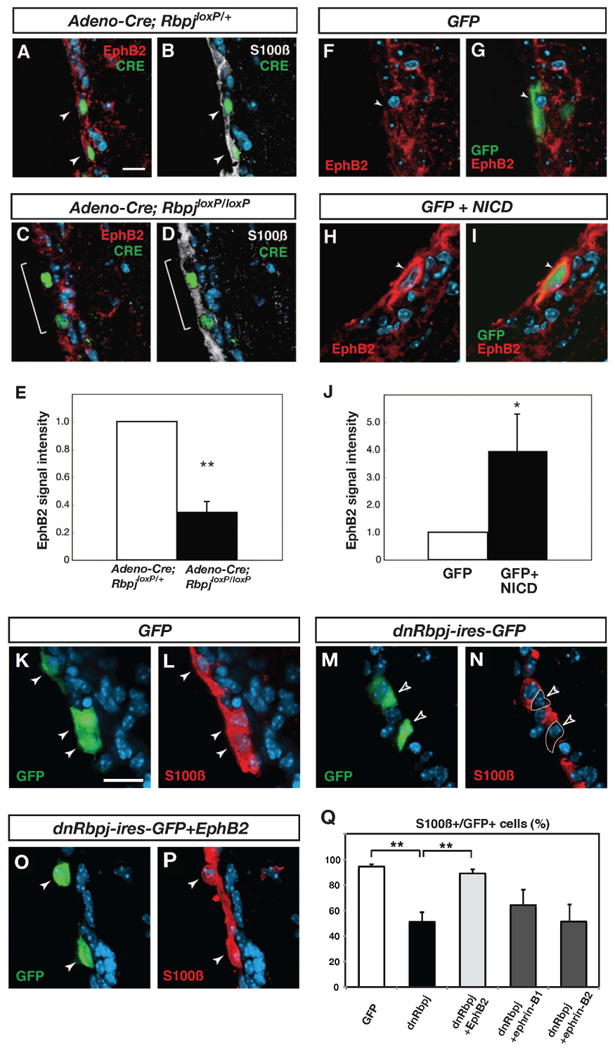
(A and B) In a mouse heterozygous for a conditional allele of Rbpj (RbpjloxP/+), EphB2 expression is maintained in ependymal cells after an adeno-Cre virus injection (indicated by white arrowheads). (C and D) In a mouse homozygous for the conditional allele of Rbpj (RbpjloxP/loxP), a decrease in EphB2 expression is evident 1 week after injection of an adeno-Cre virus (indicated by a white bracket). (E) Quantification of EphB2-immunoreactivity in ependymal cells. (F and G) Expression of EphB2 in a control animal electroporated with a GFP expression vector. (H and I) High expression of EphB2 was detected in electroporated cells 3 days after electroporation of NICD. (J) Quantification of EphB2-immunoreactivity in ependymal cells.
(K, L and Q) In mice electroporated with a GFP expression vector, the majority of GFP-expressing cells are S100ß-immunoreactive ependymal cells (white arrowheads). (M, N and Q) In mice electroporated with a dominant negative Rbpj expression vector (dnRbpj-ires-GFP), the number of S100ß-positive GFP-labeled cells is decreased to 55.9%. Open arrowheads indicate GFP-positive, S100ß-negative cells. (O, P and Q) In mice electroporated with dnRbpj-ires-GFP and EphB2 expression vectors, the number of S100ß-positive GFP-labeled cells is restored to 89.3%. White arrowheads indicate GFP and S100ß double-positive cells. The bars in (E, J, and Q) show mean + SD. *=p<0.05, **=p<0.01, Student's t-test. Scale bars represent 10 μm in (A) and 20 μm in (K).