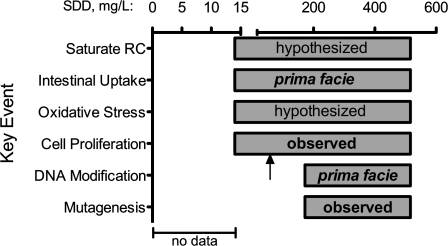
FIG. 7.
Causal and temporal associations supporting Key Events in the hypothesized MOA for intestinal tumors. Each bar represents where Key Events have been observed, inferred, or hypothesized. It is noted that DNA modification and mutagenesis could occur below the doses where tumors were observed. The arrow indicates concentration (62.5 mg/l SDD) where cell proliferation was observed in the 90-day NTP (2007) study.

