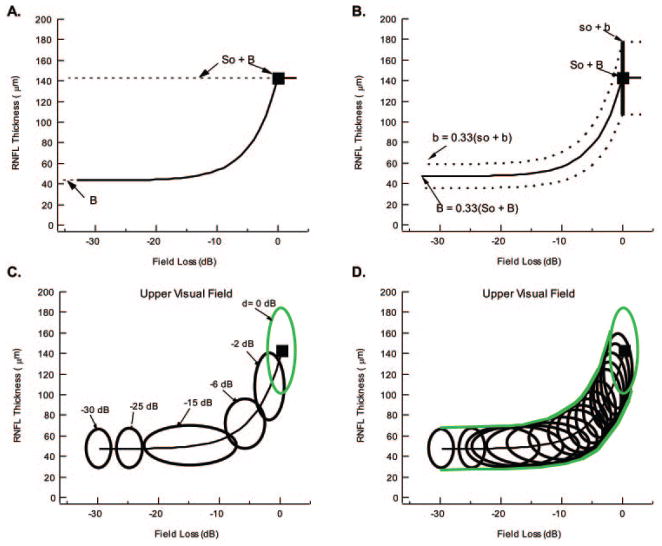
Figure 1.
(A) The predicted curve of the SLM. (B) The predicted mean curve and 95% CI of the Hood and Kardon6 model that takes variability in RNFL thickness into consideration. (C) Green ellipse: the 95% confidence boundary of the LMV in the control subjects. Black ellipses: 95% confidence boundary for losses in sensitivity ranging from 0 to −30 dB. (D) The envelope of many such black ellipses determines the 95% confidence boundaries of the LMV, as shown by the green curves.

