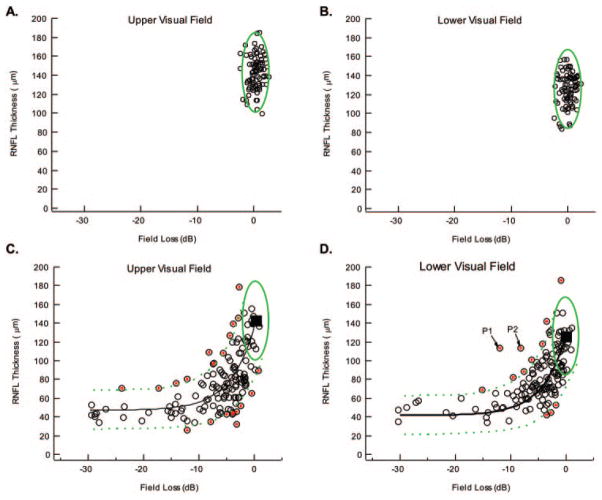
Figure 4.
(A, B) The symbols are the same data as in Figure 2C and 2D with the green ellipse showing the 95% boundary for the LMV. (C) The symbols are the same data as in Figure 2E with the extremes indicated by the red dots. Solid black curve: the mean prediction of the LMV; dashed green curves: the 95% boundary for this model. (D) Same as in (C) for the lower visual field/superior optic disc.

