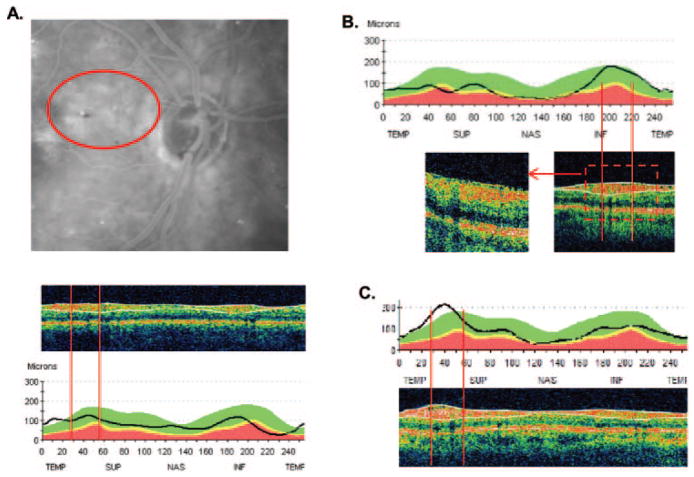
Figure 5.
(A) Top: fundus photograph showing a region of edema secondary to diabetic retinopathy. Middle: a single circle scan showing that the region within the superior arcuate window of analysis (vertical red lines) has a thick RNFL (region within the white lines). Bottom: the RNFL thickness profile for this scan. (B) RNFL thickness profile for a patient with an epiretinal membrane. Bottom right inset: scan with the region of analysis indicated by the vertical red lines; bottom left inset: a higher density image of the same region. (C) RNFL thickness profile of another patient with an epiretinal membrane. Bottom: a scan with the region of analysis indicated by the vertical red lines.

