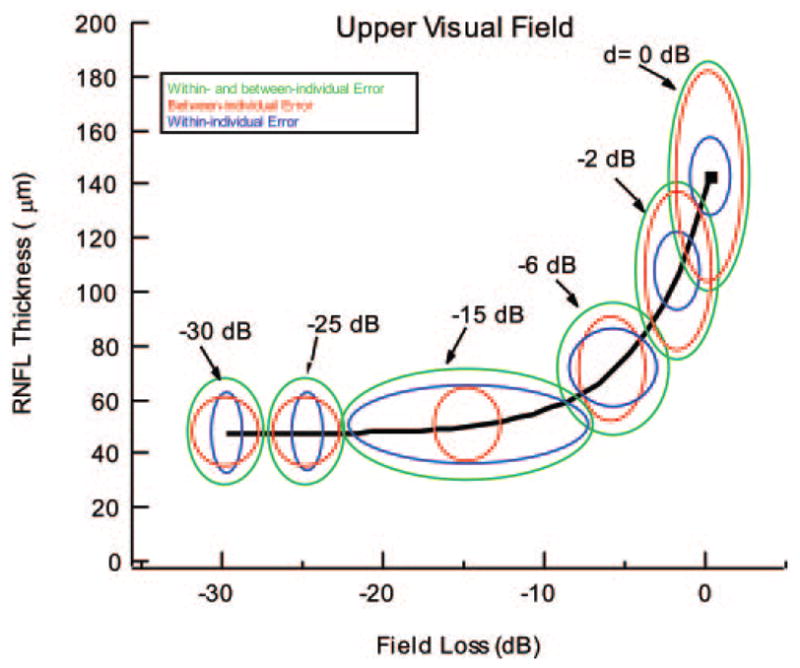
Figure 7.

The ellipses are the 95% confidence boundaries of the LMV shown for different glaucoma disease states, d, expressed in decibels of field loss. The 95% ellipses for the combined within- and between-individual variability (green), for between-individual variability excluding within-individual variability (red), and for within-individual variability excluding between-individual variability (blue) are shown for six levels of d.
