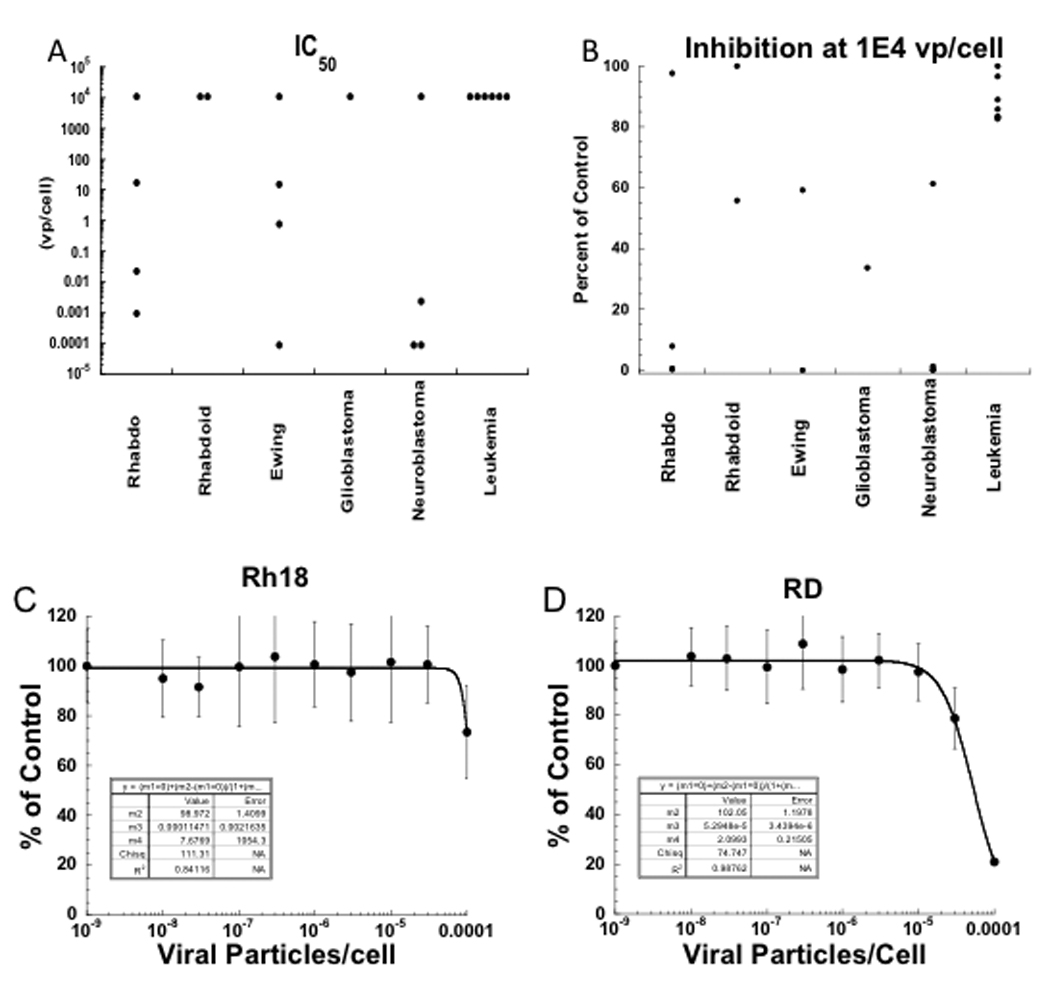
Figure 1.

NTX-010 in vitro activity. (A) graphically represents the relative potency of NTX-010 against each cell line with each point representing the IC50 of an individual line.
(B) shows the cell number (% control) at the highest NTX-010 concentration tested (1×10⁴ vp/cell). Each of the 9 cell lines that show more than 90% inhibition to NTX-010 at this concentration are in either the rhabdomyosarcoma, Ewing sarcoma, or neuroblastoma panels. (C) Representative dose-response data for sensitive (Rh18) and (D) insensitive (RD) cell lines exposed to NTX-010.
