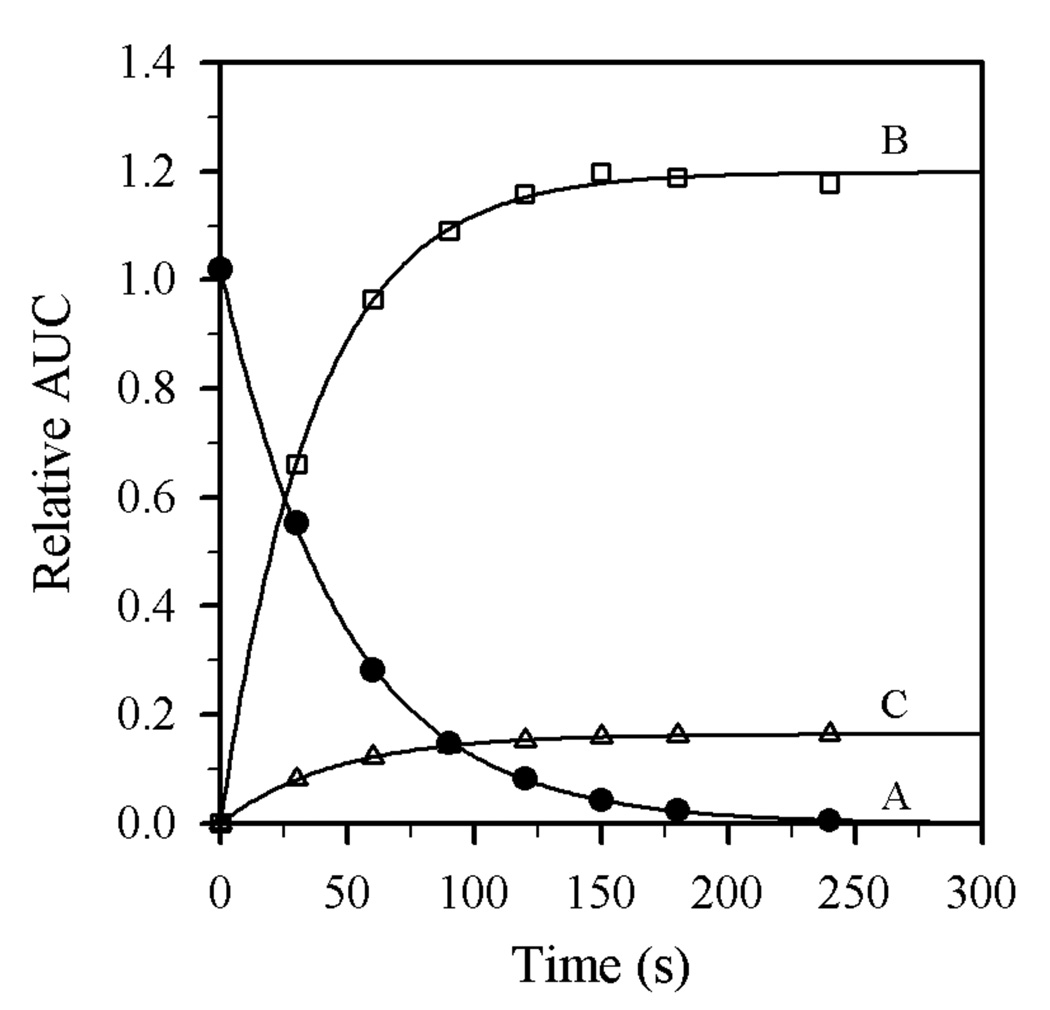
Figure 5.
Representative plot of the time-dependent decay of 1 (curve A) and formation of 2 (curve B) and 3 (curve C) relative to an n-decane internal standard (relative area under the curve, AUC) for sequentially quenched samples of a reaction mixture containing Et2NLi (0.10 M), THF (9.90 M), 1 (0.004 M), and toluene cosolvent at 0 °C. The curves depict least squares fit to: (A) y = ae−bx (a = 1.022 ± 0.005, b = kobsd = (2.11 ± 0.02) × 10−2); (B) y = {a(1−e−bx)} (a = 1.199 ± 0.006, b = kalk = (2.71 ± 0.06) × 10−2); (C) y = {a(1−e−bx)} (a = 1.648 ± 0.003) × 10−1, b = kelim = (2.25 ± 0.02) × 10−2)

