
Fig. 2.
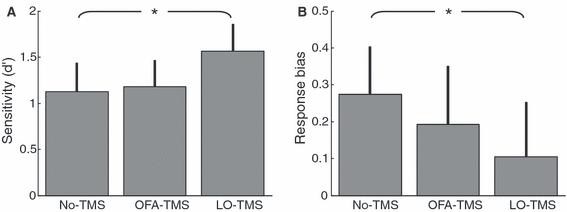
Sensitivity (A) and response bias (B) averaged across participants (n = 7) for the three TMS conditions (No-TMS, OFA-TMS, LO-TMS). Error bars denote 1 SE of the mean. Asterisks denote a significant difference between conditions (P < 0.02).
Official websites use .gov
A
.gov website belongs to an official
government organization in the United States.
Secure .gov websites use HTTPS
A lock (
) or https:// means you've safely
connected to the .gov website. Share sensitive
information only on official, secure websites.
Sensitivity (A) and response bias (B) averaged across participants (n = 7) for the three TMS conditions (No-TMS, OFA-TMS, LO-TMS). Error bars denote 1 SE of the mean. Asterisks denote a significant difference between conditions (P < 0.02).