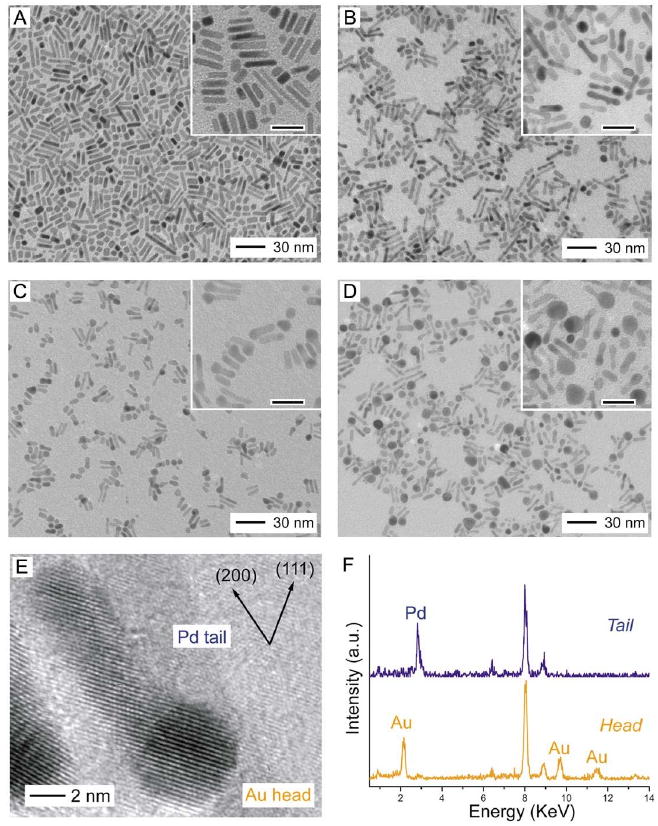
Figure 10.

TEM images of (A) Pd nanorods and (B-D) samples that were obtained by titrating Pd nanorods with increasing volumes of HAuCl4 solution. The scale bars in the insets correspond to 20 nm. (E) HRTEM image recorded along [110] for the Pd-Au tadpoles shown in (C). (F) The EDS spectra for the Pd tail and the Au head. Reproduced with permission from [80], Copyright 2007 American Chemical Society.
