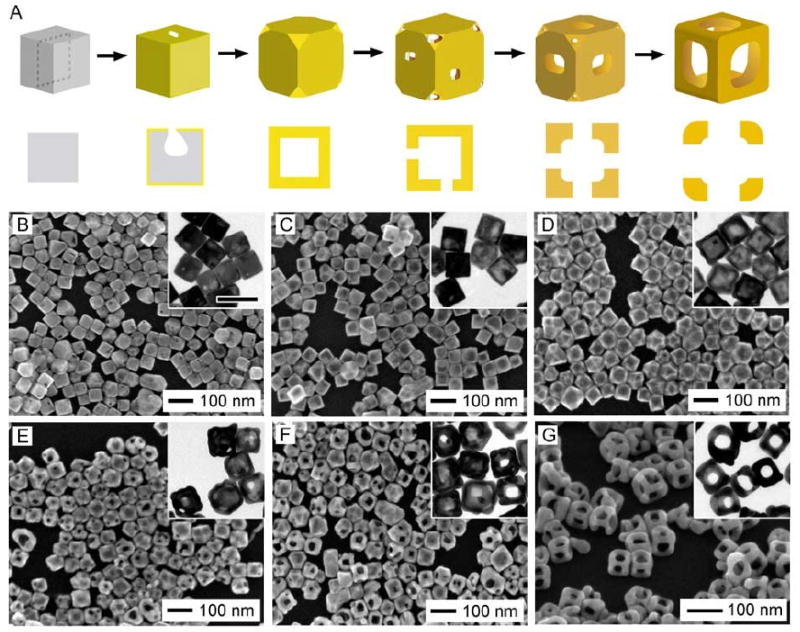
Figure 14.

(A) Schematic diagram and (B-G) SEM images with TEM insets showing different stages of the galvanic replacement reaction between Ag nanocubes and different volumes of AuCl2-. The scale bar below the images applies to all SEM images. The scale bar in the inset of (B) represents 100 nm and applies to all TEM insets. Reproduced with permission from [93], Copyright 2008 Wiley-VCH.
