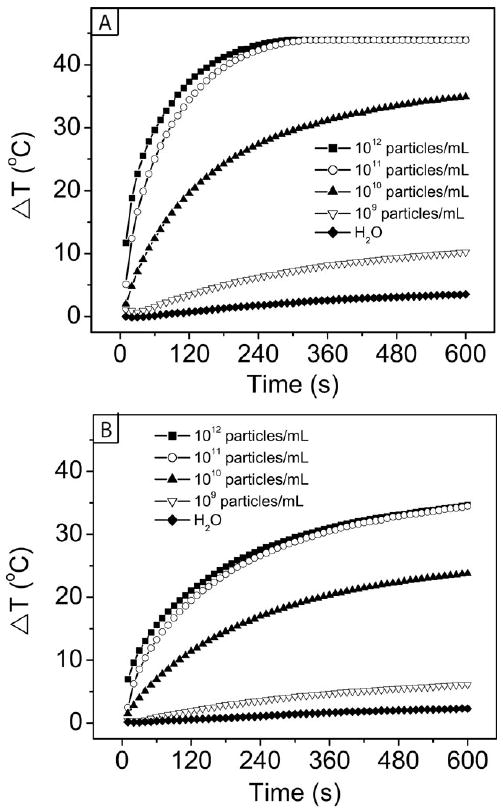
Figure 17.

Plot of temperature increase with time from the photothermal effect with different concentrations of Au nanocages at two different laser powers: (A) 1.0 W/cm2 and (B) 0.5 W/cm2. Reproduced with permission from [124], Copyright 2010 Wiley-VCH.
