
Fig. 3.
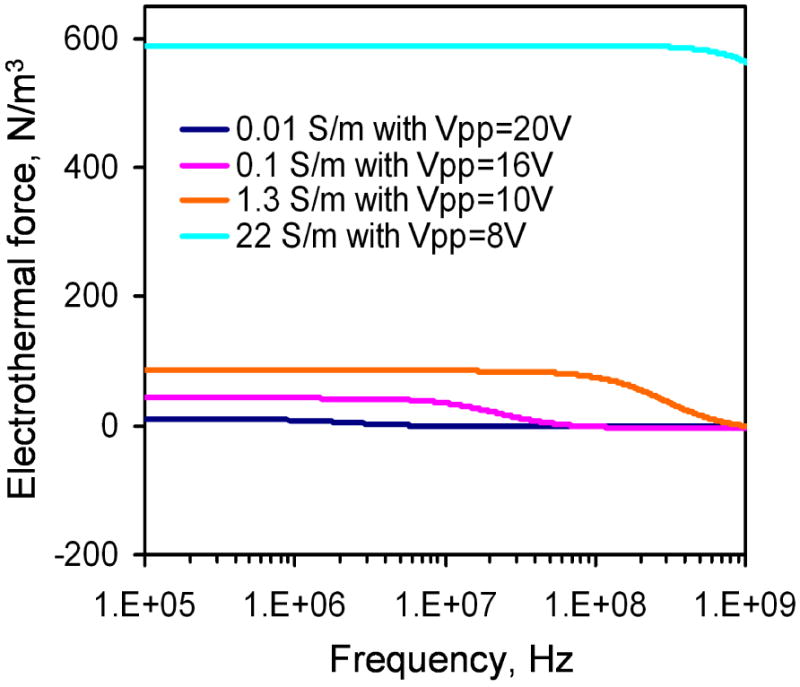
The frequency dependence of the electrothermal force for different conductivities calculated by the model. Voltages are sinusoidal waveforms with peak-to-peak voltage of 20 V, 16 V, 10 V, and 8 V for conductivities of 0.01 Sm-1, 0.1 Sm-1, 1.3 Sm-1, and 22 Sm-1, respectively.