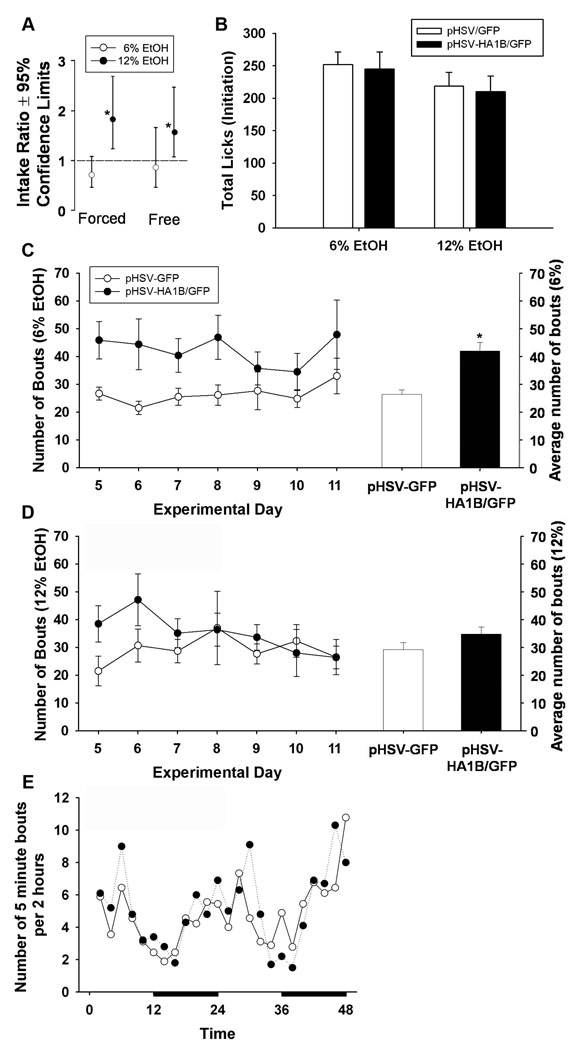
Figure 3.
Consumption of ethanol and drinking patterns during initiation drinking. (A) Drinking volume data from generalized estimating equations were back transformed to yield ethanol intake ratios (See analysis and statistics section), which revealed that pHSV-HA1B/GFP animals drank almost twice as much 12% ethanol during both forced and free access drinking, compared to pHSV-GFP animals. There were no significant differences between groups in total average licks per day on ethanol sippers (B). The number of bouts per day, as well as overall average bouts for 6% are depicted in C. pHSV-HA1B/GFP animals had significantly increased bouts for 6% ethanol, compared to pHSV-GFP animals. (D) There were no differences in bouts for 12% ethanol. (E) Representative 48-hour period of circadian activity shows the number of bouts on 6% and 12% ethanol sippers (combined) per 2 hours. Dark bars denote lights-off period. Data are presented as mean ± SEM. * = p<0.05, between groups.

