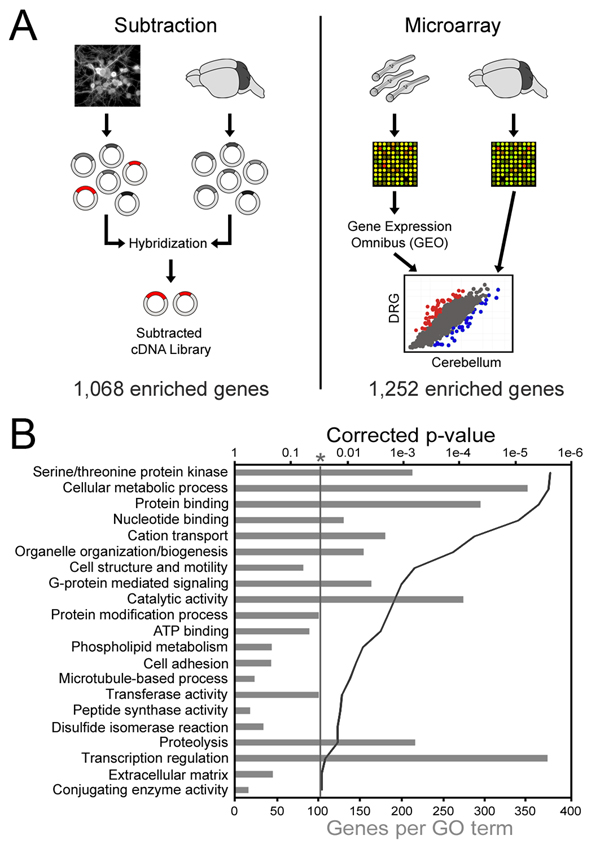
Figure 1. Identification of DRG enriched genes.
(a) Cultures of postnatal DRG neurons and whole cerebellum were used to generate cDNA libraries representing the respective mRNA populations. The cerebellum library driver was then hybridized to the DRG library tester in great excess, followed by recovery of non-bound DRG cDNAs by HAP chromatography. The resulting “subtracted” library was sequenced and BLASTed against the UniGene, whereupon 1,068 unique genes were identified. For the microarray analysis, a data set consisting of 5 replicates of LCM DRG neurons from adult mice was obtained from GEO and compared to our own set of 3 replicates of P11 cerebellum that was collected on the same microarray platform (MG-U74Av2). (b) DAVID was used to identify gene ontology terms describing subtraction genes. Grey bars represent the number of subtraction genes with the labeled annotation, and the solid line denotes the Benjamini-Hochberg corrected EASE p-value. Only terms with a corrected p-value less than 0.05 were considered.

