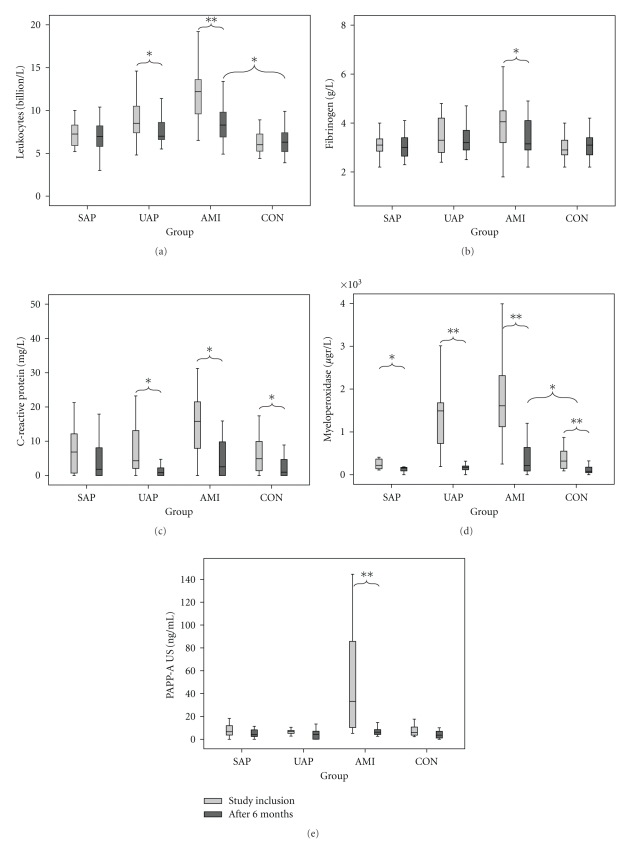
Figure 2.
Boxplots of biomarker levels of leukocyte counts (a), fibrinogen (b), C-reactive protein (c), myeloperoxidase (d), and ultrasensitive pregnancy-associated plasma protein A (e) at study inclusion and after 6-month followup. Statistical differences at 6-month followup were expressed as P < .05 (*) or P ≤ .001 (**).

