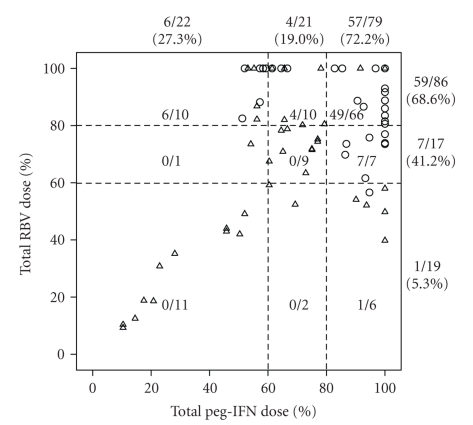
Figure 1.
Scatter plot of patients with or without SVR according to administered total doses of peg-IFN and RBV. One hundred % represents a full scheduled dose. A circle and a triangle indicate a patient with SVR and one without SVR, respectively. A number represents number of patients with SVR/total number (SVR rate).

