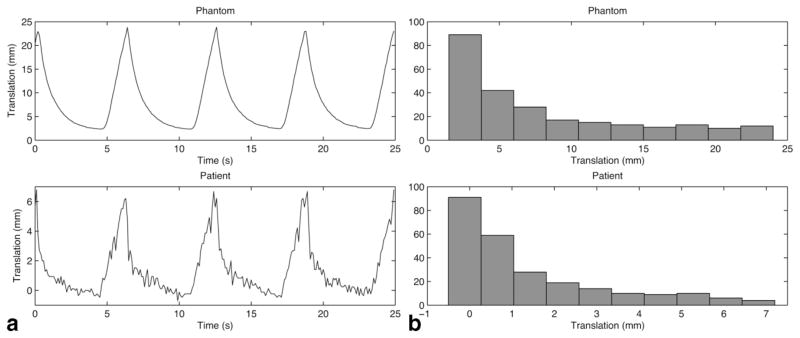
FIG. 5.
Respiratory patterns and histograms of the respiratory motion of the phantom (upper) and a patient under general anesthesia (lower). The translation of the liver in the superior–inferior direction, as measured by navigator echo, was plotted to observe the patient’s respiratory pattern. 250 points were sampled every 100 ms (corresponding to four cycles of respiration), and the translation distribution was calculated for each set of data.

