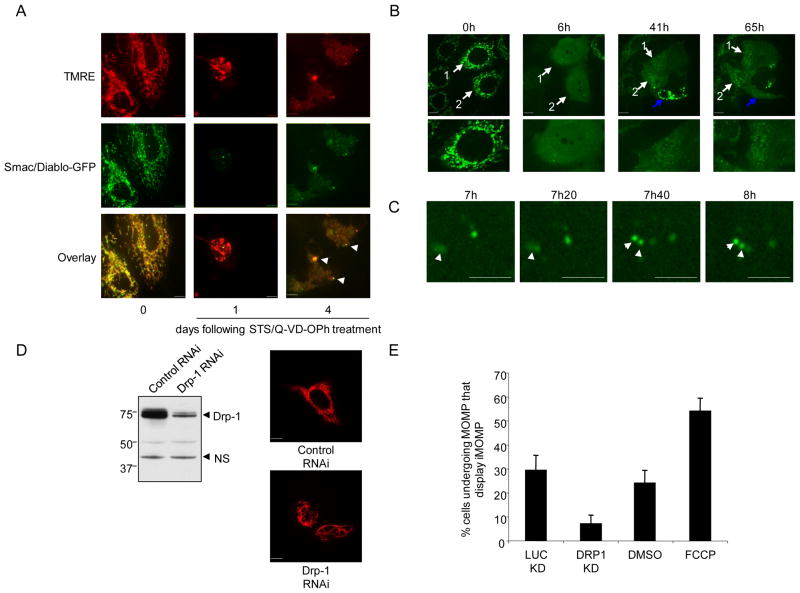
Figure 3.
Characterization of iMOMP (A) HeLa cells expressing Smac-GFP were treated with STS (1μM) and Q-VD-OPh (20μM). At various times post-treatment cells were incubated with TMRE (50nM) and imaged by confocal microscopy. Representative images are shown and arrows denote intact mitochondria. (B) MCF-7 cells expressing Smac-GFP were treated with UV (18mJ/cm2) plus Q-VD-OPh (20μM) and imaged every 20 minutes by live-cell confocal microscopy. Numbered arrows denote the same cell at different time-points. Blue arrow denotes cell that undergoes MOMP at a late time-point. The time of each frame relative to the start of image acquisition is shown. (C) Magnified panels from experiment described in Figure 3B. The time of each frame relative to the start of image acquisition is shown. (D) Left: HeLa cells were transfected with control or Drp-1 targeting shRNA vectors. Four days post-transfection and selection, cells were probed for Drp-1 levels by Western blot, ns denotes non-specific protein used as loading control. Right: HeLa or HeLa Drp-1 knockdown cells expressing mito dsRed were analyzed by confocal microscopy, representative micrographs are shown. (E) HeLa cells expressing mito-dsRed and Smac-GFP treated with DMSO or FCCP (50μM) and Drp-1 knockdown or control cells expressing mito-dsRed and Smac-GFP were treated with STS (1μM) and Q-VD-OPh (20μM). Following overnight treatment, cells were assessed. Scale bars represent 10μm. See also Figure S3.

