Figure 4.
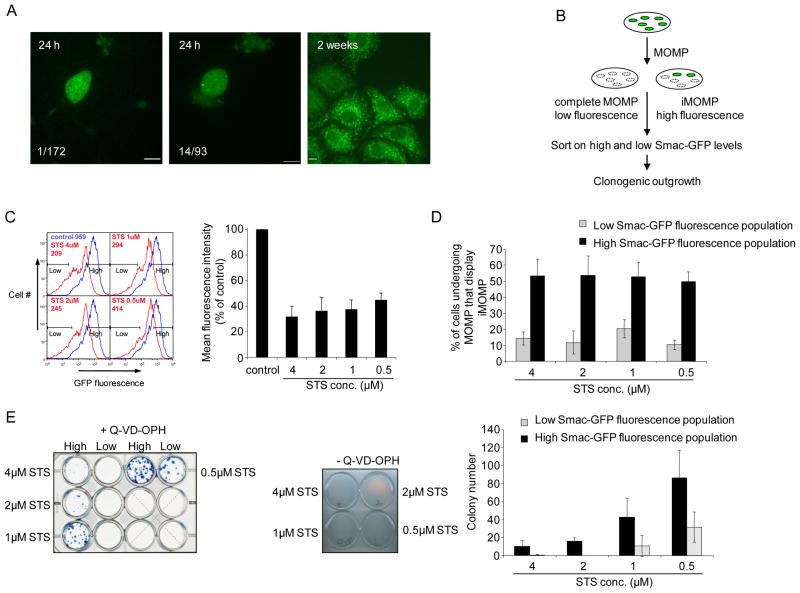
Incomplete MOMP correlates with cellular recovery from CICD. (A) Left/center: representative confocal micrographs from single-cell cultures showing complete (left) and incomplete (center) MOMP in HeLa cells expressing GAPDH and Smac-GFP following 16 hours treatment with STS (1μM) plus Q-VD-OPh (20μM) Right: widefield micrograph of a proliferating colony 14 days later. Inset numbers refer to the number of proliferating colonies that arose/the number of cells analyzed that display either complete or incomplete MOMP. The difference between groups was assessed by Chi-square analysis (p<.001). (B) Schematic experimental outline. Hela cells expressing Smac-GFP following STS treatment leading to complete MOMP will display less relative fluorescence than those displaying iMOMP. These cell populations are sorted by flow cytometry and assessed for their ability to exhibit clonogenic survival (C) HeLa cells expressing Smac-GFP were treated for 16 hours with STS (0.5μM-4μM) plus Q-VD-OPh (20μM) and analyzed by flow cytometry for GFP fluorescence intensity (inset, MFI-mean fluorescence intensity). Gates denote populations covering 20% lowest and highest Smac-GFP fluorescent populations that were sorted. Quantification of Smac-GFP MFI of STS plus Q-VD-OPh treated cells from three independent experiments expressed as percentage relative to control untreated cells, error bars represent the S.D. (D) HeLa cells expressing Smac-GFP were treated for 16 hours with STS (0.5μM-4μM) plus Q-VD-OPh (20μM) and sorted into the 20% highest and lowest GFP expressing cells and analyzed by microscopy for iMOMP. Number of cells displaying iMOMP as a percentage of cells displaying MOMP is shown, a minimum 100 cells per condition were counted. Results are from three independent experiments +/− S.D. (E) HeLa cells expressing GAPDH and Smac-GFP were treated for 16 hours with STS (0.5μM-4μM) plus Q-VD-OPh (20μM) and sorted into 20% highest and lowest GFP expressing populations. 2 × 10⁵ cells from each population were plated down in the presence of Q-VD-OPh (20μM) and examined for clonogenic outgrowth. As a control, 1 × 10⁶ cells were treated with STS (0.5μM-4μM) for 16 hours and examined for clonogenic outgrowth (middle panel). Colony number from three independent experiments, error bars represent the S.D. Scale bars represent 10μm. See also Figure S4.

