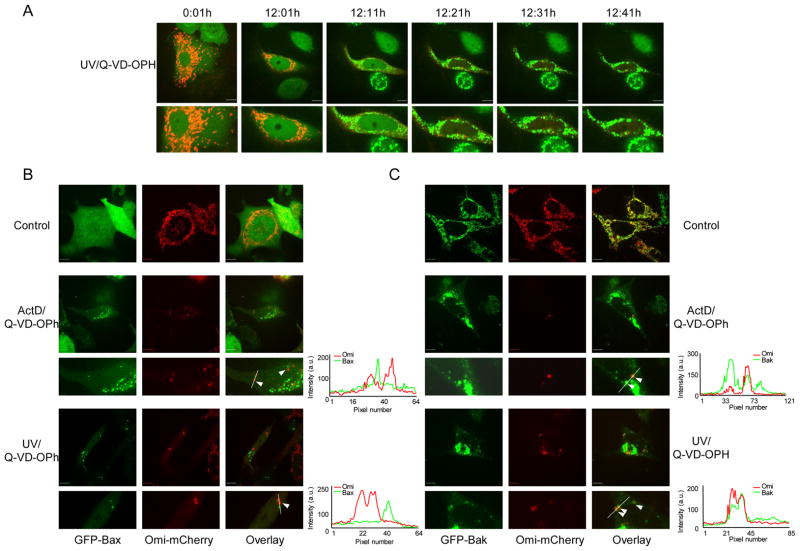
Figure 5.
Bax and Bak fail to be activated on non-permeabilized mitochondria. (A) HeLa cells expressing GFP-Bax and Omi-mCherry were treated with UV (18mJ/cm2) plus Q-VD-OPh (20μM) and imaged every 10 minutes by live-cell microscopy. Representative confocal micrographs covering the onset and duration of MOMP are shown. The time of each frame relative to the start of image acquisition is shown. (B) Bax/Bak DKO MEFs expressing GFP-Bax and Omi-mCherry were untreated or treated with UV (18mJ/cm2) or ActD (1μM) plus Q-VD-OPh (20μM). Representative confocal micrographs are shown. Arrows denote intact mitochondria that fail to have GFP-Bax in close proximity. (C) Bax/Bak DKO MEFs expressing GFP-Bak and Omi-mChery were untreated or treated with UV (18mJ/cm2) or ActD (1μM) plus Q-VD-OPh (20μM). Representative confocal micrographs are shown. Arrows denote intact mitochondria. Line scans indicate co-localization of Omi-mCherry and GFP-Bak and correlate to the line drawn in the images. Scale bars represent 10μm.

