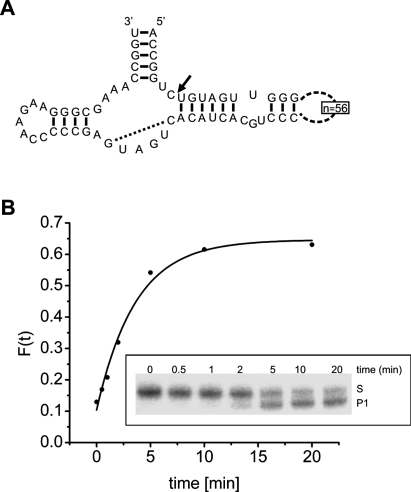
FIGURE 3.
The hammerhead ribozyme Xetr8 of Xenopus tropicalis. (A) Secondary structure, with the cleavage site indicated by an arrow and the Watson-Crick base pair in the catalytic core (Martick and Scott 2006; Przybilski and Hammann 2007) indicated by a dotted line. (B) Progress curve of the self-cleavage reaction. The cleavage reaction was performed at 37°C in 10 mM Tris-HCl (pH 7.6), 0.1 mM EDTA, and 10 mM NaCl and was started by the addition of 2 mM MgCl2. Gel analysis (inset) showing the disappearance of substrate S and the appearance of the 3′ product P1 of the self-cleavage with time (minutes). Data were analyzed by PhosphorImager and fitted to a single exponential (Stage-Zimmermann and Uhlenbeck 1998), resulting in a cleavage rate kobs = 0.28 min−1.

