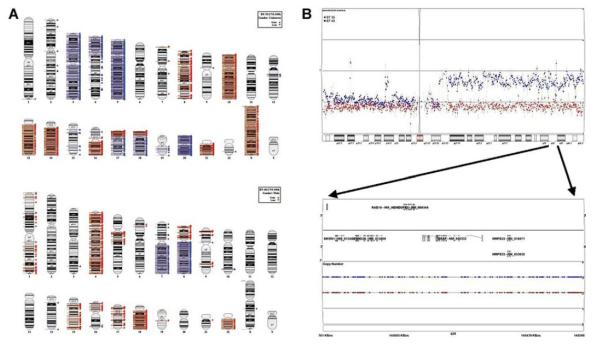
Figure 5.
Copy number analysis of BT-35 and BT-40 xenografts. Copy number analysis of BT-35 and BT-40 xenografts. Panel A. Ideograms of xenograft genomes. Genomic segments of at least 100 kb with copy gain (blue triangles) or loss (red triangles) for BT-35 (top) and BT-40 (bottom). Panel B. Copy number estimates for BT-35 (red squares) and BT-40 (blue squares) on chromosome 7 (top) and Hidden Markov model copy number states for the BRAF locus at 7q34 (bottom).

