Figure 2.
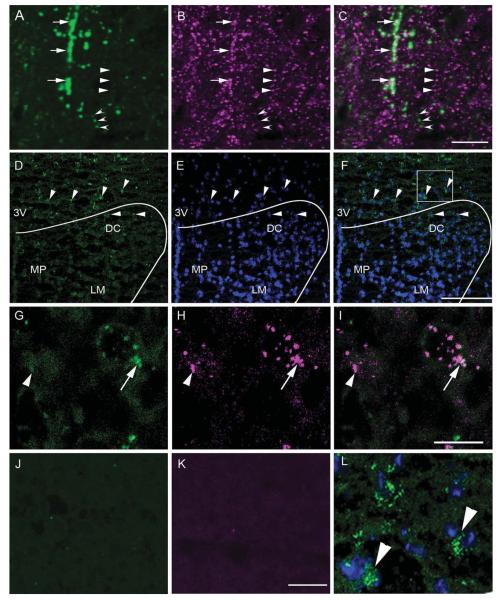
Coexpression between PTH2R and VGlut2 immunoreactivity and PTH2R and VGlut2 mRNA in the PVN area. High-magnification confocal images show PTH2R-ir fibers (A; green), VGlut2-ir fibers (B; magenta), and a merged image (C). Open arrowheads point to a fiber with only PTH2R-ir, solid arrowheads to a fiber with only VGlut2-ir, and arrows to PTH2R-ir/VGlut2-ir fibers. D: Distribution of PTH2R mRNA in the dorsal part of the PVN and adjacent peri-PVN area as detected by fluorescent in situ hybridization. The arrowheads point to cells expressing PTH2R mRNA (green). E shows DAPI counterstaining (blue), which aids visualization of the anatomical distribution of the mRNA signal. F is a merged image of the PTH2R mRNA signal and the DAPI counterstain. The curved line indicates the approximate position of the PVN. High-magnification confocal images in the third row show expression of VGlut2 mRNA (G;green), PTH2R mRNA (H; magenta), and a merged image (I). Arrow points to a double-labeled cell and an arrowhead to a cell containing only PTH2R signal. Controls with riboprobes omitted show specificity of the immunodetection of VGlut2 (J)and PTH2R (K) haptens. L: Enlarged image of the boxed area in F. 3V, Third ventricle; DC, paraventricular dorsal cap parvocellular cell group; LM, paraventricular lateral magnocellular cell group; MP, paraventricular medial parvocellular cell group. Scale bars 10 μm in C (applies to A–C); 10 μm in I (applies to G–I); 10 μm in K (applies to J–L); 100 μm in F (applies to D–F). [Color figure can be viewed in the online issue, which is available at wileyonlinelibrary.com.]

