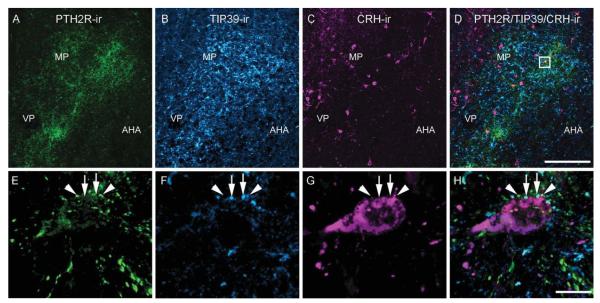
Figure 4.
Relationship among PTH2R-ir, TIP39-ir, and CRH-ir in the PVN. Images show PTH2R-ir (A; green), TIP39-ir (B; cyan), and CRH-ir (C; magenta) in the PVN. E (PTH2R-ir), F (TIP39-ir), G (CRH-ir), and H (PTH2R/TIP39/CRH-ir) are high-magnification images of the boxed area in D. Arrowheads point to PTH2R-ir, and arrows point to TIP39-ir labeled fibers adjacent to the same CRH-ir neuron (magenta). Images in E–H are 3D renderings created using the command “3D opacity” in Volocity 64 from a Z series of 12 0.5-μm sections covering 6 μm in the Z-axis. AHA, anterior hypothalamic area; MP, paraventricular medial parvocellular cell group; VP, paraventricular ventral parvocellular cell group. Scale bars = 100 μm in D (applies to A–D); 10 μm in H (applies to E–H). [Color figure can be viewed in the online issue, which is available at wileyonlinelibrary.com.]

