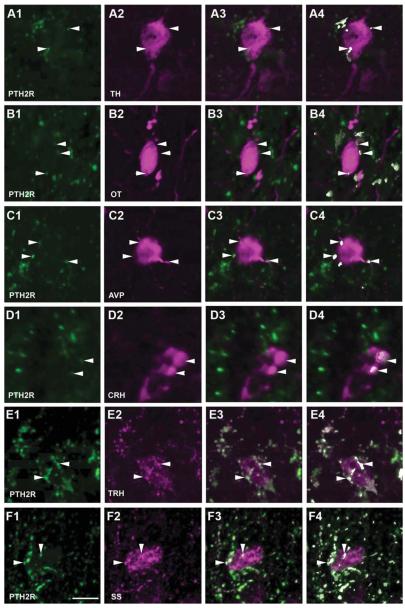
Figure 5.
Relationship between PTH2R and neuroendocrine immunoreactivity in the PVN area. PTH2R-ir fibers are green in all images. Magenta labels tyrosine hydroxylase (TH; A2–4), oxytocin (OT; B2–4), arginine-vasopressin (AVP; C2–4), corticotrophin-releasing hormone (CRH; D2–4), thyrotropin-releasing hormone (TRH; E1–4), and somatostatin (SS; F2–4). Single channels are shown in the first and second columns, merged images in the third column, and merged images in which regions containing suprathreshold levels of both labels are pseudocolored white are in the fourth column. Arrowheads and the white pseudocolor in the fourth column indicate touching points, as defined by areas that contain both green and magenta labeling above threshold. Images are single optical sections; analysis was performed on Z-series as described in Materials and Methods. Scale bar = 10 μm. [Color figure can be viewed in the online issue, which is available at wileyonlinelibrary.com.]

