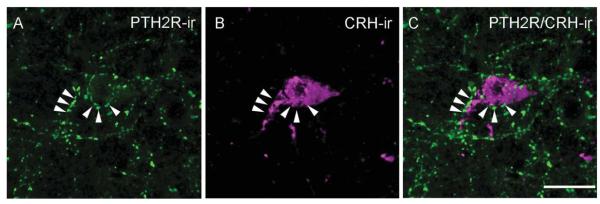
Figure 6.
High-magnification image of PTH2R-ir fibers (A; green) and a CRH-ir cell (B; magenta) in the PVN. C shows PTH2R/CRH merged image of a CRH-ir neuron enveloped by PTH2R-ir fibers, indicated by arrowheads. The image is a 3D rendering created using the command “3D opacity” in Volocity 64 from a Z-series of 12 0.5-μm sections covering 6 lm in the Z-axis. Scale bar = 10 μm. [Color figure can be viewed in the online issue, which is available at wileyonlinelibrary.com.]

