
Figure 3.
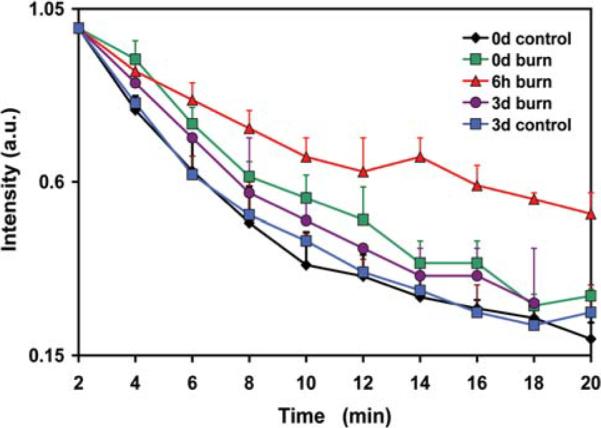
The decay kinetics of the nitroxide (CPA) in the gastrocnemius muscle of the mice in control and burn groups. The redox status of the control group was measured at day 0 (0d) and day 3 (3d). The redox status of the burn group was measured at day 0, 6 h and day 3. Values are means ± SE; n=4.