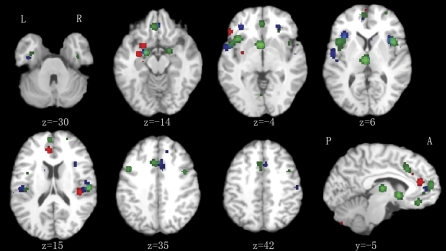
Fig. 1.
Control Comparison Analyses. Gray matter volumes lower in high-risk group (red), first episodic group (blue), and chronic group (green) compared with healthy controls. Significance thresholded with a false discovery rate at P < .01. z represents the z coordinates in Talairach space. L, left; R, right; A, anterior; P, posterior.

