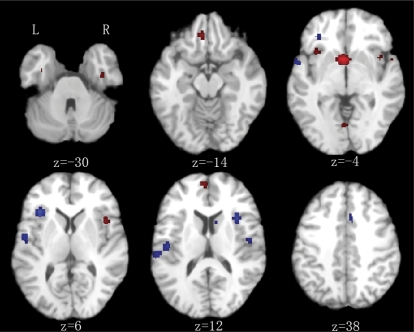
Fig. 3.
Subtraction Analysis Chronic Vs First-Episode Schizophrenia (FES) Group. Red: lower gray matter volume in chronic schizophrenia. Blue: lower gray matter volume in FES. Significance thresholded with a false discovery rate at P < .01. z represents the z coordinate in the Talairach space. L, left; R, right.

