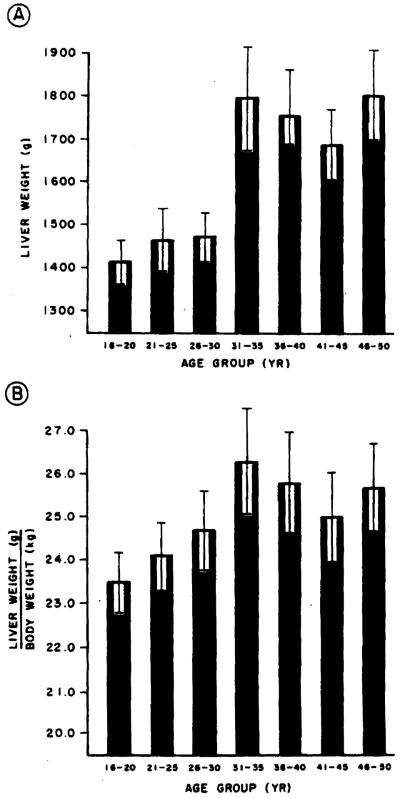
Figure 1.
Liver weight in grams (A) and liver weight in grams corrected for body weight in kilograms (B] for women aged 16–50 yr grouped in 5-yr intervals. The bars represent mean values. The brackets represent the standard error of the mean. Note that liver size increases until age 26–30 and then achieves a plateau.

