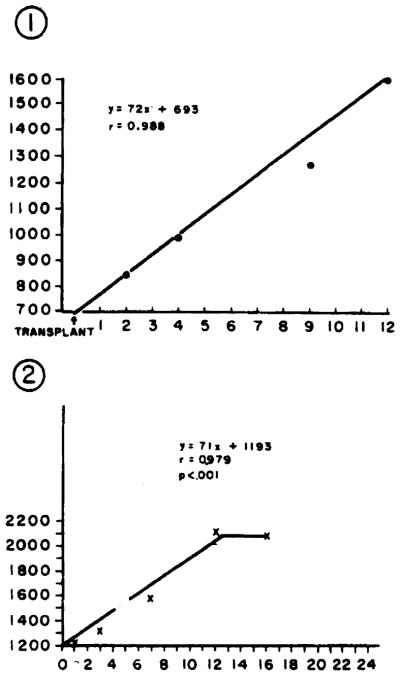
Figure 3.
Growth of an intact small-for-size normal liver transplanted into a larger recipient. The changes observed in graft size for the 2 cases reported are shown in the component parts of the figure. The ordinate for each component graph is milliliters of liver determined by CT scanning. The number in the left upper corner of each figure reflects the patient number referred to in the text.

