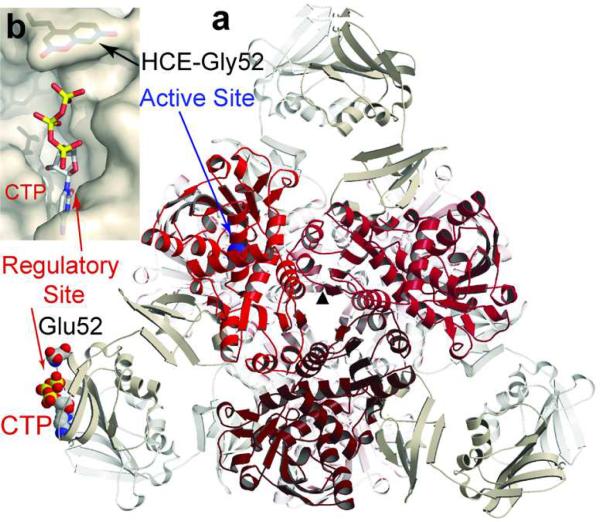
Figure 1.
Structural model of CTP bound to HCE-Gly52R ATCase. a) The structure of ATCase viewed down the three-fold axis (σ). The three c chains of the top trimer are shown in shades of red, three of the six r chains closer to the viewer are shown in tan. The three c and three r chains more distal are shown in light gray. For an adjacent c and r chain, the active and regulatory sites are labeled. Also shown is the location of Glu52 and CTP bound to the regulatory site in one r chain. b) Surface representation of the allosteric site with CTP bound, and HCE-Gly52R modeled in position.

