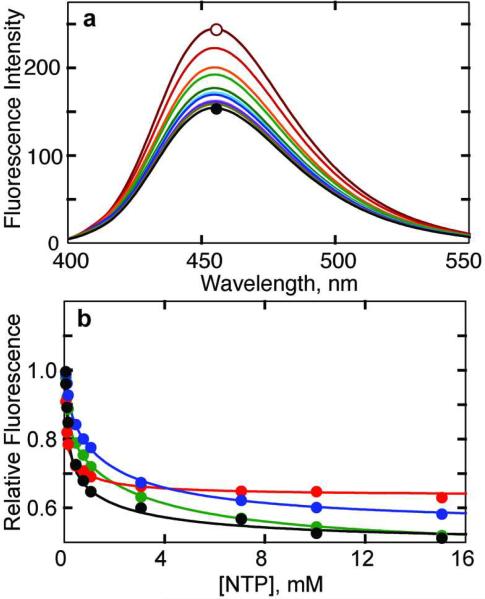
Figure 3.
Monitoring nucleotide binding to HCE-Gly52R ATCase by fluorescence. a) Fluorescence spectrum of HCE-Gly52R ATCase as a function of the CTP concentrations. 50 μg ml−1 of HCE-Gly52R ATCase in 50 mM Tris-acetate pH 8.3 at 25 °C was excited at 360 nm and the emission spectrum was measured from 400–550 nm. The open circle represents the spectrum of enzyme in the absence of CTP. As the CTP concentration was increased to 15 mM (closed circle) in 12 aliquots, the emission intensity at 455 nm decreased significantly. b) Alteration in the fluorescence of the HCE-Gly52R ATCase upon the binding of ATP (green), CTP (red), and UTP (blue), and GTP (black). The fluorescence intensity at 455 nm was normalized to the highest value (0 mM NTP) and plotted versus the nucleotide concentration. Conditions similar to those used in part a.

