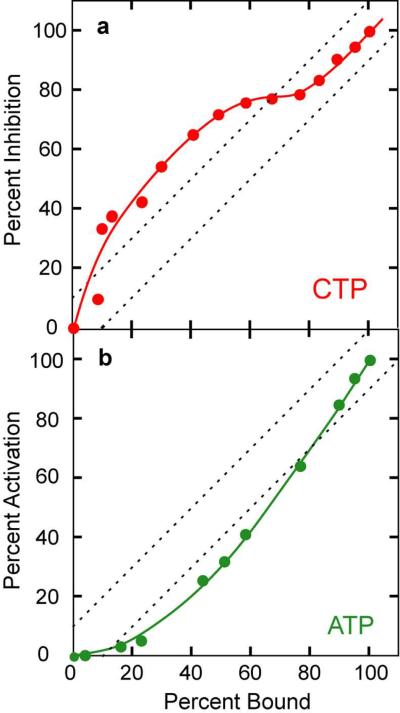
Figure 6.
Relationship between the saturation of allosteric sites by CTP or ATP and inhibition or activation of enzyme activity. a) Percent saturation of regulatory sites versus the percent of maximum inhibition by CTP (red circles). The dashed lines delineate the approximate width of a 45° line due to experimental uncertainties. b) Percent saturation of regulatory sites versus the percent of maximum activation by ATP (green circles). Kinetic and fluorescence measurements performed at pH 8.3 as described in METHODS.

