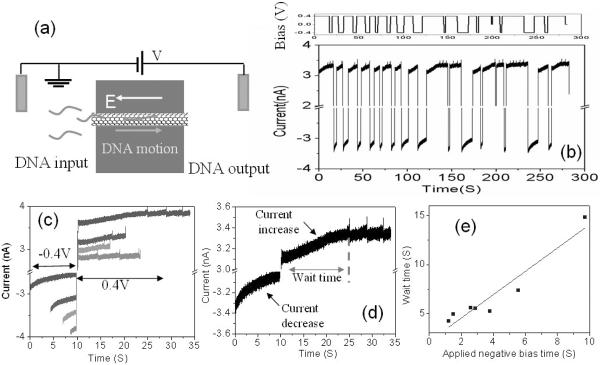
Figure 5.
(a) The schematic of a DNA translocation measurement setup. The electrode at input reservoir is always grounded. 0.1nM 60 nt DNA is injected in the input reservoir. (b) The time trace of ionic current when switching the polarity of bias at output reservoir. (c) Re-organized ionic current data by aligning ionic current at voltage transition position. (d) The zoom-in of one typical data. The current magnitude always increases at positive bias and decreases at negative bias. Spikes appear after a wait time at positive bias and no spikes at negative bias. (e) The relationship between the wait time and the applied negative bias. The solid line is a linear fit to the experimental data.

