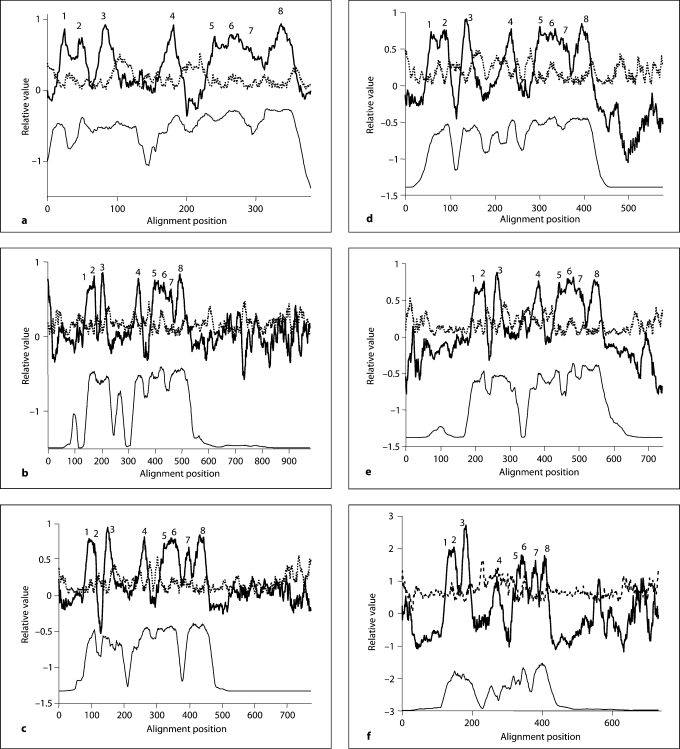
Fig. 2.
Relative average hydropathy (solid dark lines, top), average amphipathicity (dotted gray lines, top) and average similarity (solid but thin lines, bottom) plots for the 5 families of proteins in the AI-2E superfamily. a–e Families 1–5, respectively. The Ave-HAS program was used to derive the plots using all members of each of the 5 families included in this study [47] . Peaks of hydrophobicity that are believed to correspond to the 8 putative TMSs are numbered above the hydropathy plot. Assignments were confirmed using the WHAT [26] and TMHMM [48] programs for individual proteins. These plots are based on the multiple alignments shown in figure S3–S7.

