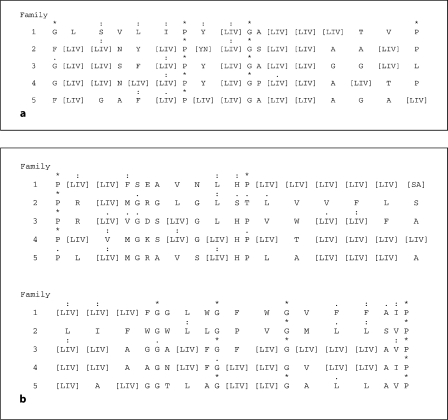
Fig. 3.
Consensus motifs 1 (a) and 2 (b) showing degrees of relative conservation in the most conserved regions of the proteins of the 5 families within the AI-2E superfamily. Asterisks indicate identities only; colons indicate close similarities; dots indicate more distant similarities as defined by the CLUSTAL × program for each of the 5 families (1–5); alternative consensus residues at any one position are indicated in brackets. b The longer motif is presented in two lines.

