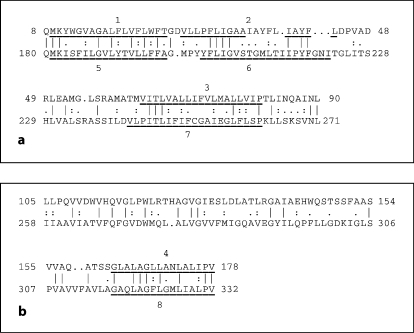
Fig. 4.
Alignments of TMSs 1–3 (top) with TMSs 5–7 (bottom; a) and TMS 4 (top) with TMS 8 (bottom; b) and their preceding regions. The alignments were generated with the GAP program [27]. Vertical lines indicate identities; colons indicate close similarities; dots indicate more distant similarities as defined by the GAP program [27]. Residue numbers in each protein are indicated at the beginning and end of each line.

