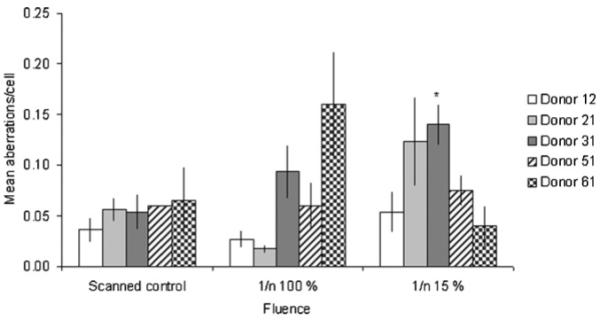
Fig. 1.

Inter-individual differences in radiosensitivity. Primary lymphocytes were collected from five different donors and irradiated. Mean aberrations per cell (±SEM) from 2 to 6 experiments are plotted. 1/n (100%) indicates a single 3He2+ track to all of the cells (fully irradiated), and 1/n (15%) indicates a single 3He2+ track to 15% of the cells on the microbeam dish. Increases in aberrations are taken to indicate radiation-induced genomic instability (RIGI) when significantly elevated compared to control values (indicated by * when p 0.05).
