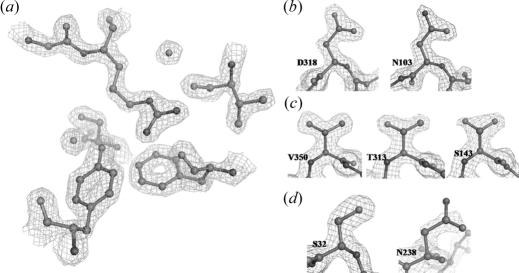
Figure 1.
(a) Close view of a ball-and-stick representation of the R374 region in the HPBP structure at 1.9 Å resolution. The 2f obs − f calc electronic density map is contoured at 1.75σ. (b) Comparison between the electronic density shapes of N103 and D318. The 2f obs − f calc electronic density map is contoured at 1.5σ. (c) Comparison between electronic density shapes of V350, T313 and S143. The 2f obs − f calc electronic density map is contoured at 1.5σ. (d) Comparison between the electronic density shapes of N238 and S32. The 2f obs − f calc electronic density map is contoured at 1.5σ.

