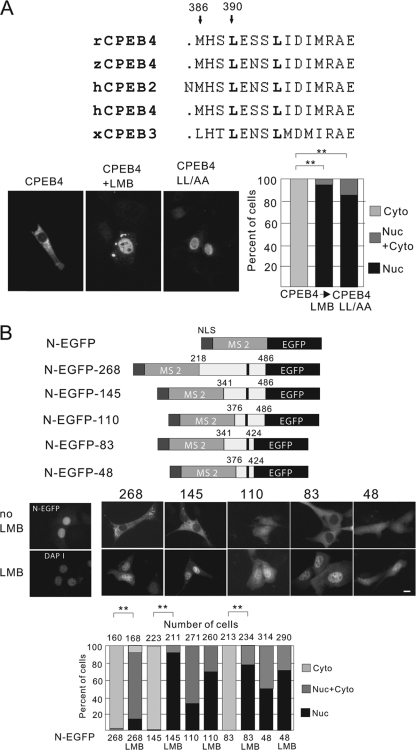
FIG. 5.
Identification of CPEB4 nuclear export signal. (A) Alignment of the human CPEB4 protein sequence from residues 383 to 397 with homologous regions from rat and zebrafish CPEB4 and human and Xenopus CPEB2 and CPEB3. Two arrows point to conserved leucine residues that have been mutated to alanine in the LL-AA mutant. NIH 3T3 cells were transfected with DNA encoding myc-tagged wild-type or LL-AA mutant CPEB4 proteins for 12 h, treated with LMB for 1 h and then fixed and immunostained for the myc-tagged protein. Quantification of the CPEB4 proteins in the nucleus and cytoplasm are as described in the legend to Fig. 1. The asterisks refer to statistically significant differences (P < 0.01, Student's t test) between the results for the indicated samples. (B) Fusion proteins used to identify the minimal CPEB4 NES domain. Various regions of the CPEB4 coding region (the numbers refer to amino acid residues) that contain the NES were fused to the SV40 T NLS, the bacteriophage MS2 coat protein, and EGFP. The dark bar indicates the leucine residues indicated in panel A (top). Middle, NIH 3T3 cells were transfected with DNA encoding the fusion proteins noted above. The image in the left panel shows that the NLS-EGFP-MS2 protein, without any CPEB4 sequence, was nuclear. The other panels show the nuclear-cytoplasmic distribution of the fusion proteins in neurons, some of which were treated with LMB. Size bar = 10 μm. Bottom, quantification of the GFP-CPEB4 fusion proteins in the nucleus or cytoplasm as described in the legend to Fig. 1. The asterisks refer to statistically significant differences (P < 0.01, Student's t test) between the results for the indicated samples.

