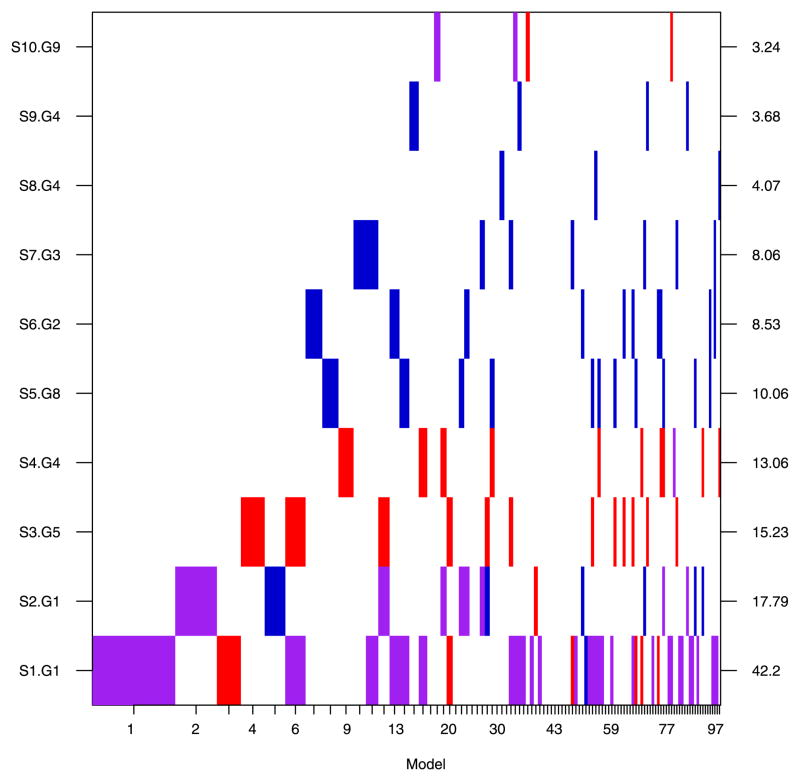
Fig. 2.
Image plot of the SNP inclusion indicators for the SNPs with marginal Bayes factors greater than 3.2 and the top 100 Models. The color of the inclusion block corresponds to the genetic parametrization of the SNP in that model. Purple corresponds to a log-additive parametrization, red to a dominant parametrization and blue to a recessive parametrization. SNPs are ordered on the basis of their marginal SNP Bayes factors which are plotted on the right axis across from the SNP of interest. Width of the column associated with a model is proportional to its estimated model probability.

